About
Who Am I?
I’m Cyber02, a cybersecurity engineer passionate about hands-on problem-solving. Over the years, I’ve explored everything from networking and penetration testing labs to professional certifications, documenting each step along the way. I thrive on making complex concepts easy to understand through cheatsheets, diagrams, and interactive graphs. After building an extensive personal collection of notes packed with tips and real-world experiences, I decided to share them with the community through a graph-interactive blog.
Why Graphs?
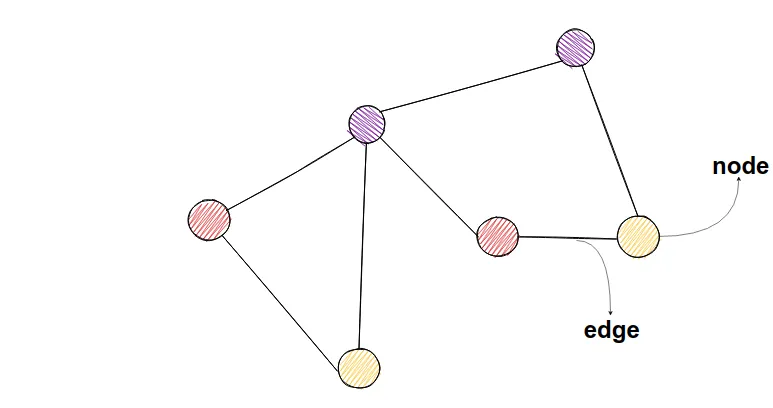
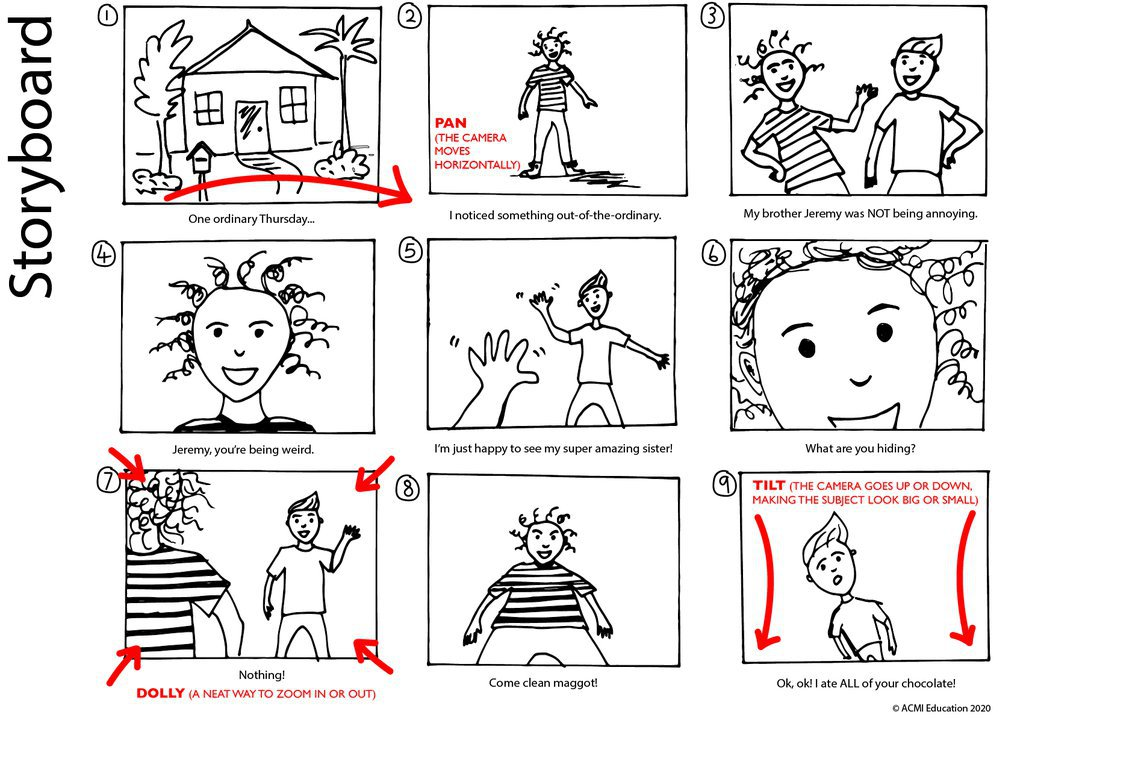
I chose a graph-based approach because it mirrors the way I think and work as a filmmaker. Just like a storyboard lays out the skeleton of a movie, a graph organizes ideas, concepts, and information visually, letting me see the big picture while diving into details whenever needed. When I need a specific command, tip, or concept, it’s much faster to navigate a graph than to scroll through thousands of paragraphs in traditional note-taking software. Psychology also shows that humans remember and retain information more effectively when it’s presented visually and relationally, making a graph not just practical, but cognitively powerful.
My Mission
I want to help learners and professionals cut through the noise and learn faster. By sharing my notes, labs, and real-world experiences in a visual and interactive way, I aim to make cybersecurity concepts accessible, memorable, and immediately practical. This blog is my way of turning years of hands-on experience into a resource that anyone can use to grow their skills efficiently.
What You’ll Find Here
-
Hands-on Labs: Step-by-step guides and walkthroughs.
-
Cheatsheets & Visuals: Quick references and diagrams to simplify complex topics.
-
Interactive Graphs: Navigate interconnected ideas, explore relationships, and find exactly what you need fast.
A Personal Touch
✨ Beyond cybersecurity, I’m a filmmaker at heart. I love creativity, storytelling, and seeing the bigger picture. This perspective shapes how I organize and share knowledge. Each note, diagram, or graph is part of a larger story, designed to be explored and understood intuitively.
Find some of my creations on my Instagram page 📷
Dive In
Whether you’re here to study, explore, or just satisfy curiosity, I invite you to dive into my interactive graph, browse through labs, and explore the connections that make complex topics click. Welcome to a different way of learning. You can start with this blog explaining my note taking process.